Photogrammetry vs. LiDAR: Applying the Best Technology for the Job


LiDAR Use Cases
Below are eight usage cases for LiDAR technology that illustrate the range of the technology’s methodologies:
Excerpted from Encyclopedia Britannica’s Website, LiDAR: Scientific Technique, Eric Gregerson, www.britannica.com/technology/lidar
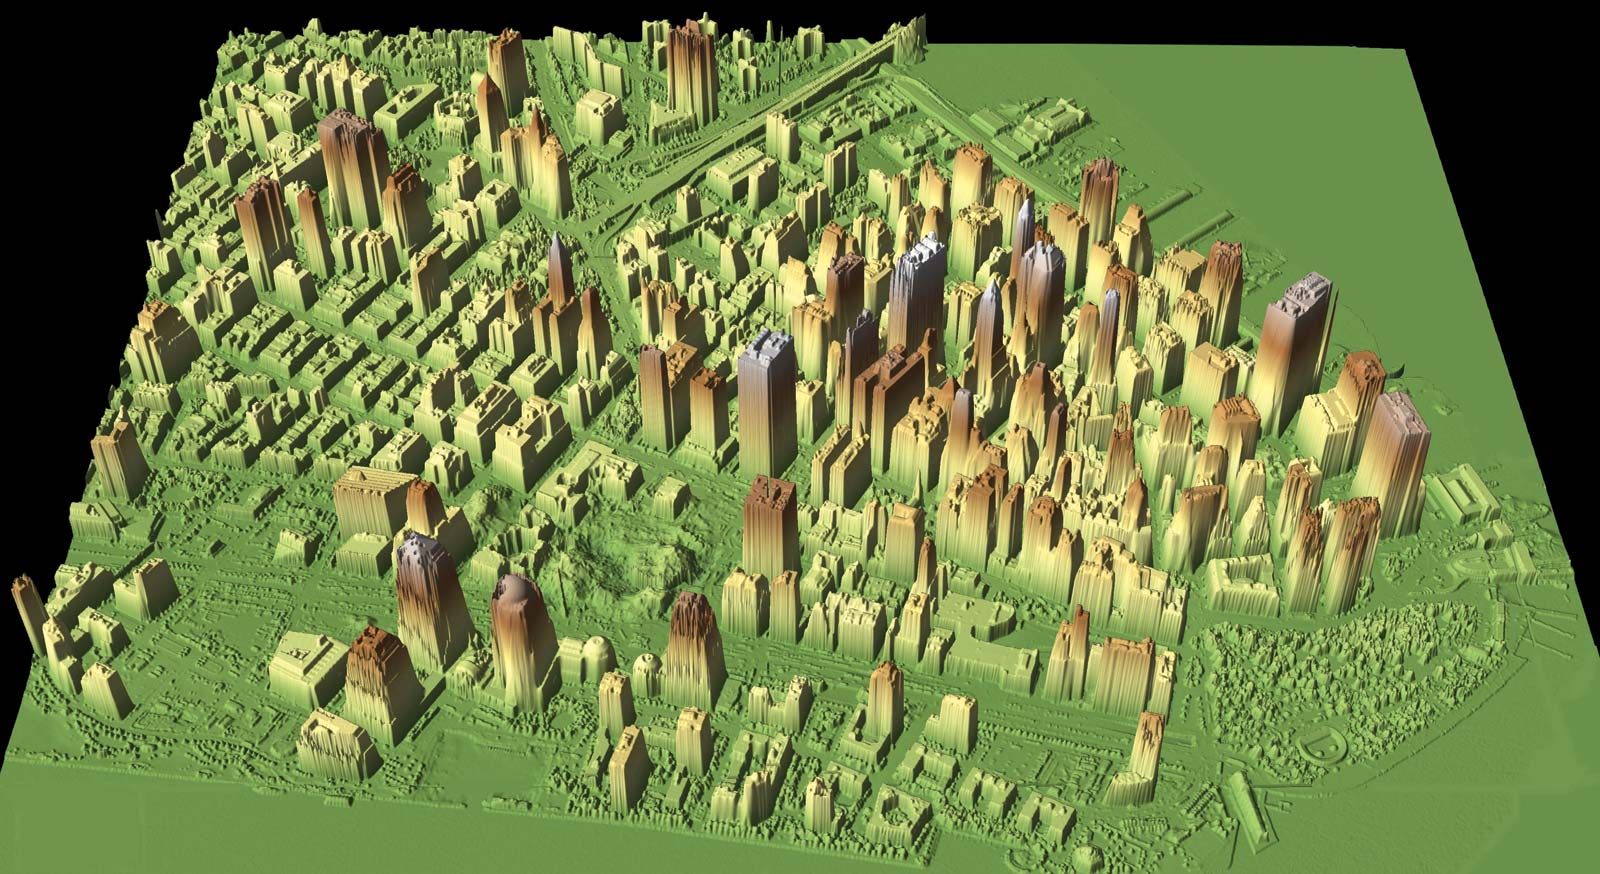
A series of LiDAR flyover flights were conducted to capture valuable data about the depth of rubble at the World Trade Center site post-911, and also to identify the original structural underpinnings of the buildings. This LiDAR image shows the World Trade Center and surrounding buildings.
#1. World Trade Center Terrorist Attack Documentation Using Flyover LiDAR
After the World Trade Center attack occurred in New York City on Sept. 11, 2001, the intensity of the poisonous fumes and the depth of the rubble made it all but impossible to assess damage at the site or to plan for an approach for removing the debris.
Photogrammetry was also out of the question, as it could not penetrate the smoky cloud cover for a clear line of sight, nor the layers of rubble to ascertain rubble depth.
The choice was to use a series of World Trade Center flyovers in which planes were equipped with LiDAR instrumentation. The LiDAR data collected from these flyovers aided in identifying the height of the rubble so plans could be made to remove it. At the same time, LiDAR data collected provided information that building and utility engineers needed in order to locate the World Trade Center's original foundation support structures.
Excerpted from NASA Scientific Visualization Studio, Visualizing by Alex Kekesi, Released on June 12, 2018, svs.gsfc.nasa.gov/4532
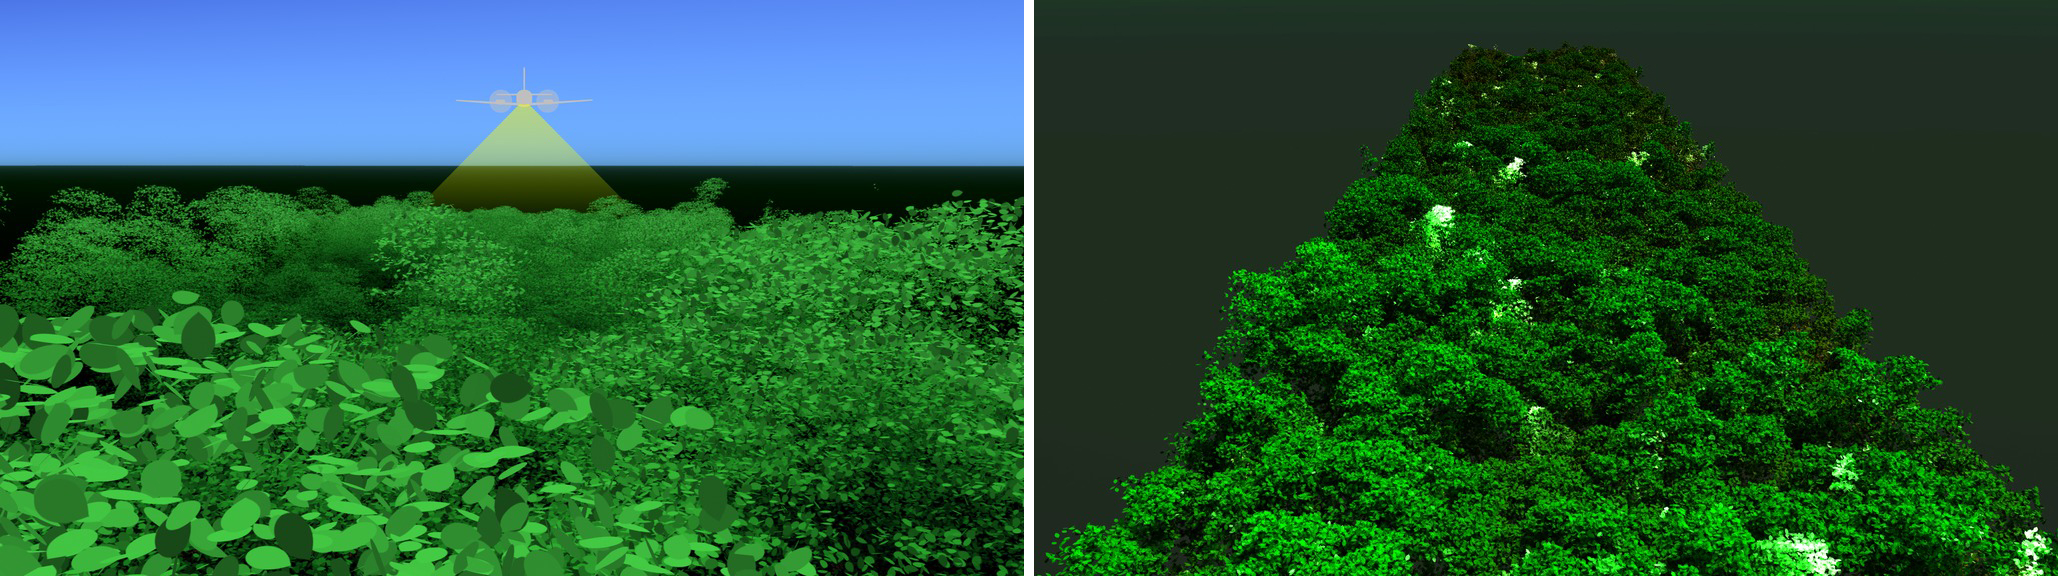
These particular images were the result of LiDAR that was used to record a noticeable change in the canopy of the Brazilian rain forest.
#2. Rainforest Forest Floor Documentation Using Flyover LiDAR
The Amazon rainforest is too dense and inaccessible for researchers to study the forest floor, soils and fauna in person. The solution was to use flyover planes equipped with LiDAR instrumentation that could measure topography elevations and characteristics through the use of laser beams that bounced back from the Earth's surface. These LiDAR-emitted laser beams could also determine additional characteristics of the rainforest floor through the use of multi-spectral light.
In one LiDAR usage case, a plane collected LiDAR data over a 50-kilometer swath of the Brazilian rainforest. To illustrate ground features, data returned from the LiDAR showed colors that ranged from deep brown to tan. The vegetation heights are depicted in shades of green with the vegetation in dark green colors being those plants that were closest to the ground and the vegetation in lighter greens being those plants that were further from ground level. In another rainforest use case, LiDAR was used to chart the changes in rain forest canopy (illustrated below).
#3. Land Management-Cascadia Landslide
After the Cascadia Earthquake Landslide occurred in the Columbia River Gorge near Stevenson, Washington, aerial LiDAR was used to map and explore the site of the slide, measuring digital elevations and assisting in assessing the situation and how to approach it. By onboarding LiDAR on an aircraft, investigators avoided the necessity of having to send a land crew into the area’s hazardous conditions.
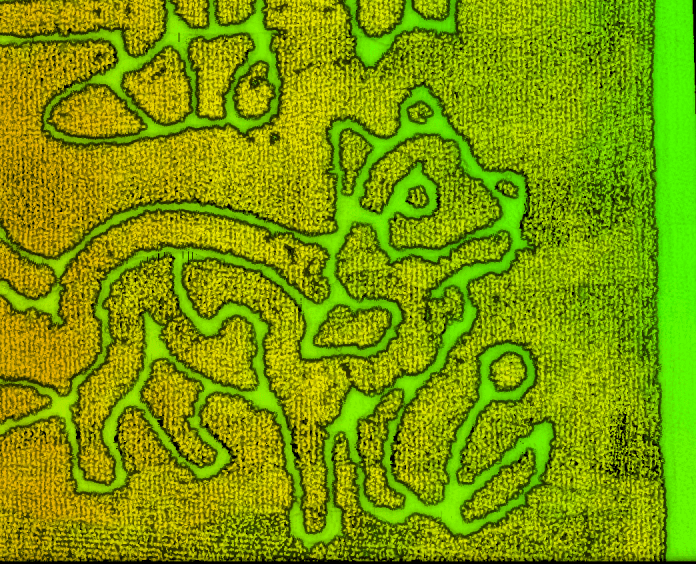
#4. Farming in New Springfield, Ohio
LiDAR is being used for topographical analysis and the prediction of soil properties and conditions in agriculture. It is also being used for farm field surveys, and for measuring plant structures. All of this work has a goal of assisting farm producers in selecting better fertilizers, planting the optimum crops in a given farm plot, assessing field drainage, and so on. The end objectives are to obtain the best possible crop yield.
Excerpted from Lidarnews: blog.lidarnews.com/precision-agriculture-informed-drone-lidar
LiDAR was used capture this image of nine miles of trails cut rough a 21 acre corn field to commerce rate the 80th anniversary of the movie, “The Wizard of Oz.”
In New Springfield, Ohio, LiDAR is being used for a slightly different purpose. It was used to document a corn maze that contained nine miles of trails that were carved out over of 21 acres of corn. The project was done in order to commemorate the 80th anniversary of the classic film, “The Wizard of Oz.”
On a day-to-day working basis, agricultural practitioners are more focused on using LiDAR to assess the viability of the different soil types in their fields. The information they obtain on best fertilizers can be fed into automated systems on spreaders to assure that certain fertilizers are spread on some soils while other fertilizer choices are used on other soils. Because LiDAR can target different areas of a field to prescribe best practice solutions, the overall farming practice is known as precision agriculture. Its purpose is to increase crop yields.
#6. Atmospheric Density and Pollution Control in Maryland
LiDAR instrumentation can identify airborne and waterborne particles and is effective in locating elements like carbon dioxide, sulfur dioxide and methane. When the LiDAR imagery is combined with a software-based building or terrain model, researchers can use this data to observe pollutant information and to detect a pollutant build-up in a given area.
The State of Maryland Department of the Environment wanted to understand how particles in the air mixed vertically over a period of time, as well as understanding particle travel patterns. With the use of LiDAR, particles in the air were tracked as they were mixing down near ground level. The measurements of these particles warned Department meteorologists in advance of potential poor air quality. This assisted the Department in preparing daily air quality forecasts and also enabled Department personnel to study pollution and air quality patterns in the past and compare them to what was happening today.
#7. Assessing Habitat for the Red Squirrel
LiDAR remote sensing is used in conservation and ecological research, and is often used to assess habitat suitability for various species. LiDAR is also employed to map areas where flooding and droughts could occur.
In one study, LiDAR was used for the conservation management of red squirrels.
LiDAR’s remote sensing enabled the direct retrieval of vegetation structures while habitat for the red squirrel was being evaluated.
In this use case, the University of Edinburgh wanted to identify habitats that could sustain the endangered European red squirrel. The goal was to identify the habitat for the red squirrel that would be viable for the long-term.
The University used LiDAR to identify variables and features in the Abernethy Forest in Scotland. It concluded that only 27 percent of the forest areas that it studied were suitable for the red squirrel to survive in.
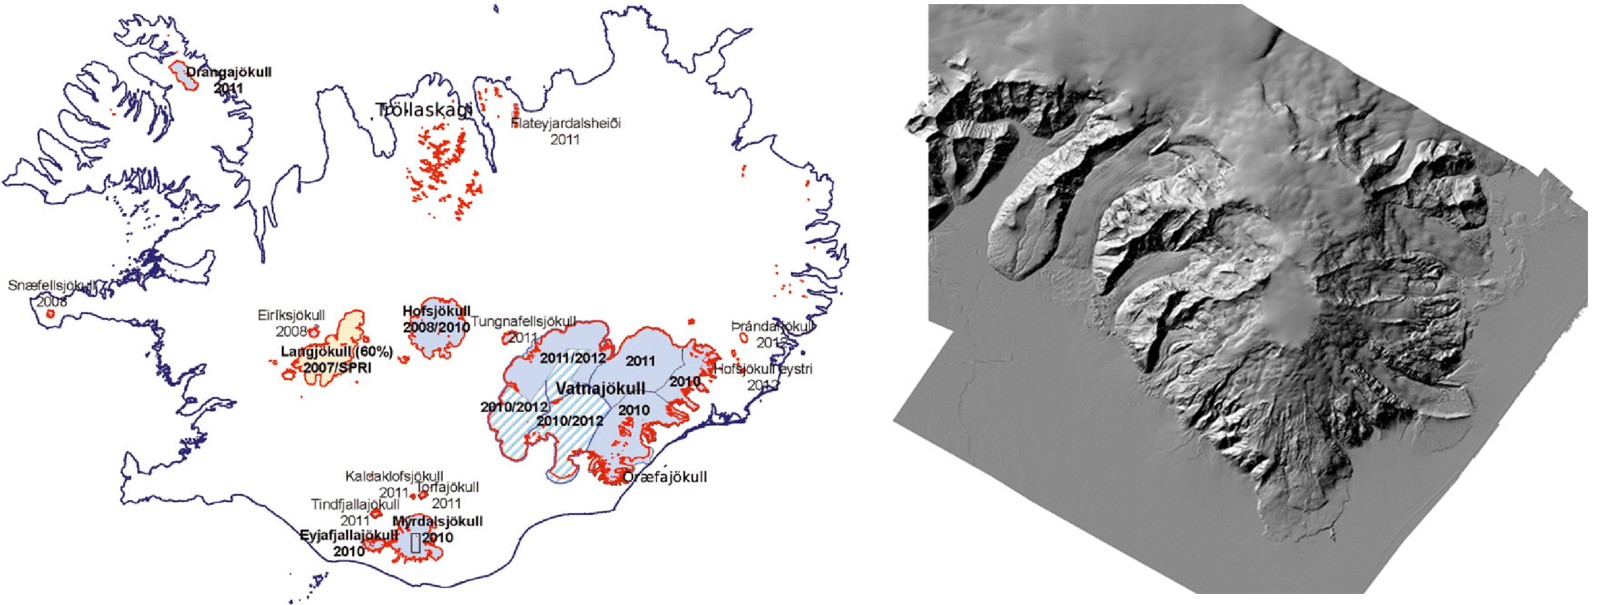
Photo excerpted from Researchgate: www.researchgate.net/figure/Location-map-of-Icelandic-glaciers-showing-the-status-of-the-lidar-mapping-at-the-end-of_fig1_259131814
Location map of Icelandic glaciers showing the status of the LiDAR mapping at the end of a 2012 surveying effort. Glacier outlines (red curves) were delineated from the period 1999-2004, and blue areas were surveyed in 2008-11. Hatched areas were surveyed in 2012.
#8. Measuring Iceland’s Glaciers
LiDAR measurements are being used to measure the loss of glacial mass in Iceland. One of the major measurements has been logging the amount of glacial volume, and then comparing it to past volume measurements of the glaciers that were taken several years ago. The work has confirmed the glacial melt that is occurring in the earth’s Polar regions.
