Photogrammetry vs. LiDAR: Applying the Best Technology for the Job


Learning Objectives:
- Define what photogrammetry is and how it originated.
- Define what LiDAR is and how it originated.
- Describe the differences between photogrammetry and LiDAR.
- Identify the different use cases for photogrammetry and LiDAR.
- Cite at least one case where a combination of LiDAR, photogrammetry and/or bathymetry can be used.
Credits:
As an IACET Accredited Provider, BNP Media offers IACET CEUs for its learning events that comply with the ANSI/IACET Continuing Education and Training Standard.
This course may qualify for continuing education through the FBPE.
This course may qualify for continuing education through the NYSED. For further information, please visit the NYSED website at http://www.op.nysed.gov/prof/pels/peceques.htm.
Purpose statement:
This course will help you to understand the technological differences between photogrammetry and LiDAR (light detection and ranging) as it is crucial for land surveyors and geospatial professionals to get the best accuracy out of both methodologies.LiDAR (light detection and ranging) and traditional photogrammetry play a role in nearly all land surveying and mapping projects today. LiDAR has evolved into an accurate, cost-effective method of generating the mass points used to create a digital elevation model. The increases in the accuracy of LiDAR sensors have been impressive, if not astonishing, over the last couple of years. Today’s LiDAR sensor technology allows us to place points on the ground at very dense postings and achieve extremely accurate elevations for these points.
However, aerial photography is still necessary to generate breaklines at abrupt changes in the terrain. These breaklines are normally collected from photography at the edges of roadways and water bodies; at the tops and toes of slopes; along headwalls and retaining walls; and other places in the landscape with sudden changes in elevation. Stereo photography is also used for planimetric feature capture common in large-scale mapping. Typical planimetric features collected in mapping include the edges of roadways, building footprints, driveways, fences, utility poles, group vegetation, sidewalks and drainage features that are easily seen in project photography.
Lastly, photography also serves as the base for digital orthophotography. Digital orthophotos are generated for most mapping projects today to supplement topographic and planimetric mapping. They can be a significant source of information, during planning and design, and serve as a useful tool for communicating with a lay audience that likely doesn’t fully understand more traditional maps (such as at public hearings).
Source: wingtra.com/drone-photogrammetry-vs-lidar
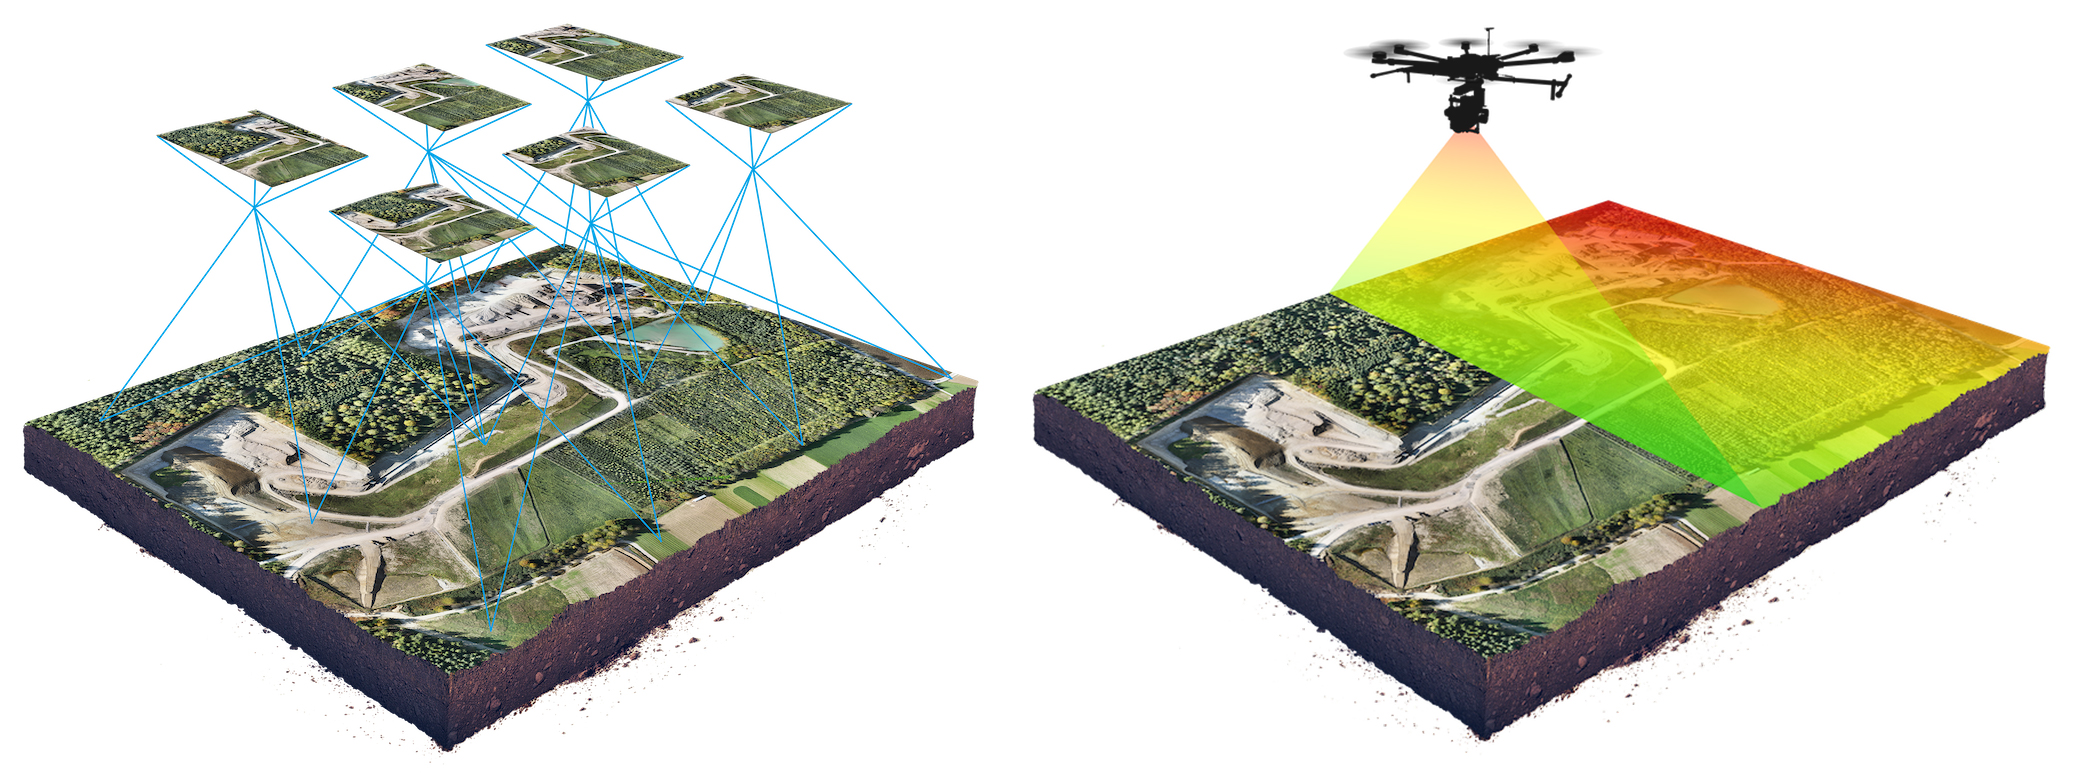
A drone survey mission (left) using photogrammetry compared to a LiDAR drone survey mention (right). Whether in the sky, on land or inside, the choice between photogrammetry and LiDAR depends heavily on the exact application.
But are breaklines always required for topographic mapping? As data postings from LiDAR become denser, can mass points without breaklines provide an accurate model of the ground? Collected from fixed-wing aircraft (airplanes), data postings from the LiDAR collection used for large-scale projects normally range from one to four points per square meter. Rotary wing aircraft (helicopters) can collect significantly more dense data, but unit costs compared to fixed-wing aircraft are considerably higher due to the slower speeds and narrower swath widths common with this collection. Point densities of 80 or more points per square meter are common with helicopter-based units. At these densities, breaklines provide very little additional information to a digital elevation model. But helicopter-based applications are normally constrained to specialized applications because of the higher unit costs and not employed on typical large block projects like city/county or statewide mapping.
Higher density data will continue to be collected as LiDAR sensors continue to improve, and there may get to a point where breaklines are not as necessary due to the increased density of the mass points available from fixed-wing collection. Yet, for most projects, LiDAR technology is not quite there yet.
Land surveyors and geospatial professionals use photogrammetry and LiDAR (light detection and ranging) in a variety of visual mapping and land survey documentation projects. Both technologies can often produce similar output, though they are really quite different in the methodologies that they employ. For any land surveyor or geomatics practitioner, understanding the differences between the two technologies — what they are and when to use them — will improve accuracy, efficiency and ensure the project achieves the desired results.
When tasked with documenting, mapping and/or surveying objects in a visual medium, both photogrammetry and LiDAR can be excellent choices. The key is to understand the benefits and challenges of both technologies so that the best technical approach can be chosen for any given project or situation.
This course covers the history and mechanics of photogrammetry and LiDAR technologies. Also to be examined are use cases where photogrammetry or LiDAR, or a combination both, will enable the best result.
The History of Photogrammetry & Technology Development
Photogrammetry is the science of using photographs to make reliable measurements between objects. Using a series of photogrammetric photos, users can recreate geometric representations of the photographed objects.
The earliest known mention of photogrammetry’s concepts was in 1480 when Leonardo DaVinci wrote, “Perspective is nothing else than the seeing of an object behind a sheet of glass, smooth and quite transparent, on the surface of which all the things may be marked that are behind this glass. All things transmit their images to the eye by pyramidal lines, and these pyramids are cut by said glass. The nearer to the eye these are intersected, the smaller the image of their cause will appear.”
Much later, during the 1850s, French scientist Aimé Laussedat pointed out the potential for mapping using photography. Decades after that, various photogrammetry experiments began during World War I and World War II. However, it wasn't until 1984 when Professor Ian J. Dowman of University College London proposed that photogrammetry could be used as a digital means of mapping the topography of terrain by using satellite imagery. This was the point at which commercial uses for photogrammetry began to emerge.
Aerial photography is one of photogrammetry’s most common mediums to obtain photogrammetric images. A drone captures a large number of high-resolution photos over an area. These images overlap such that the same point on the ground is visible in multiple photos and from different vantage points. In a similar way that the human brain uses information from both eyes to provide depth perception, photogrammetry uses these multiple vantage points in images to generate a 3D map.
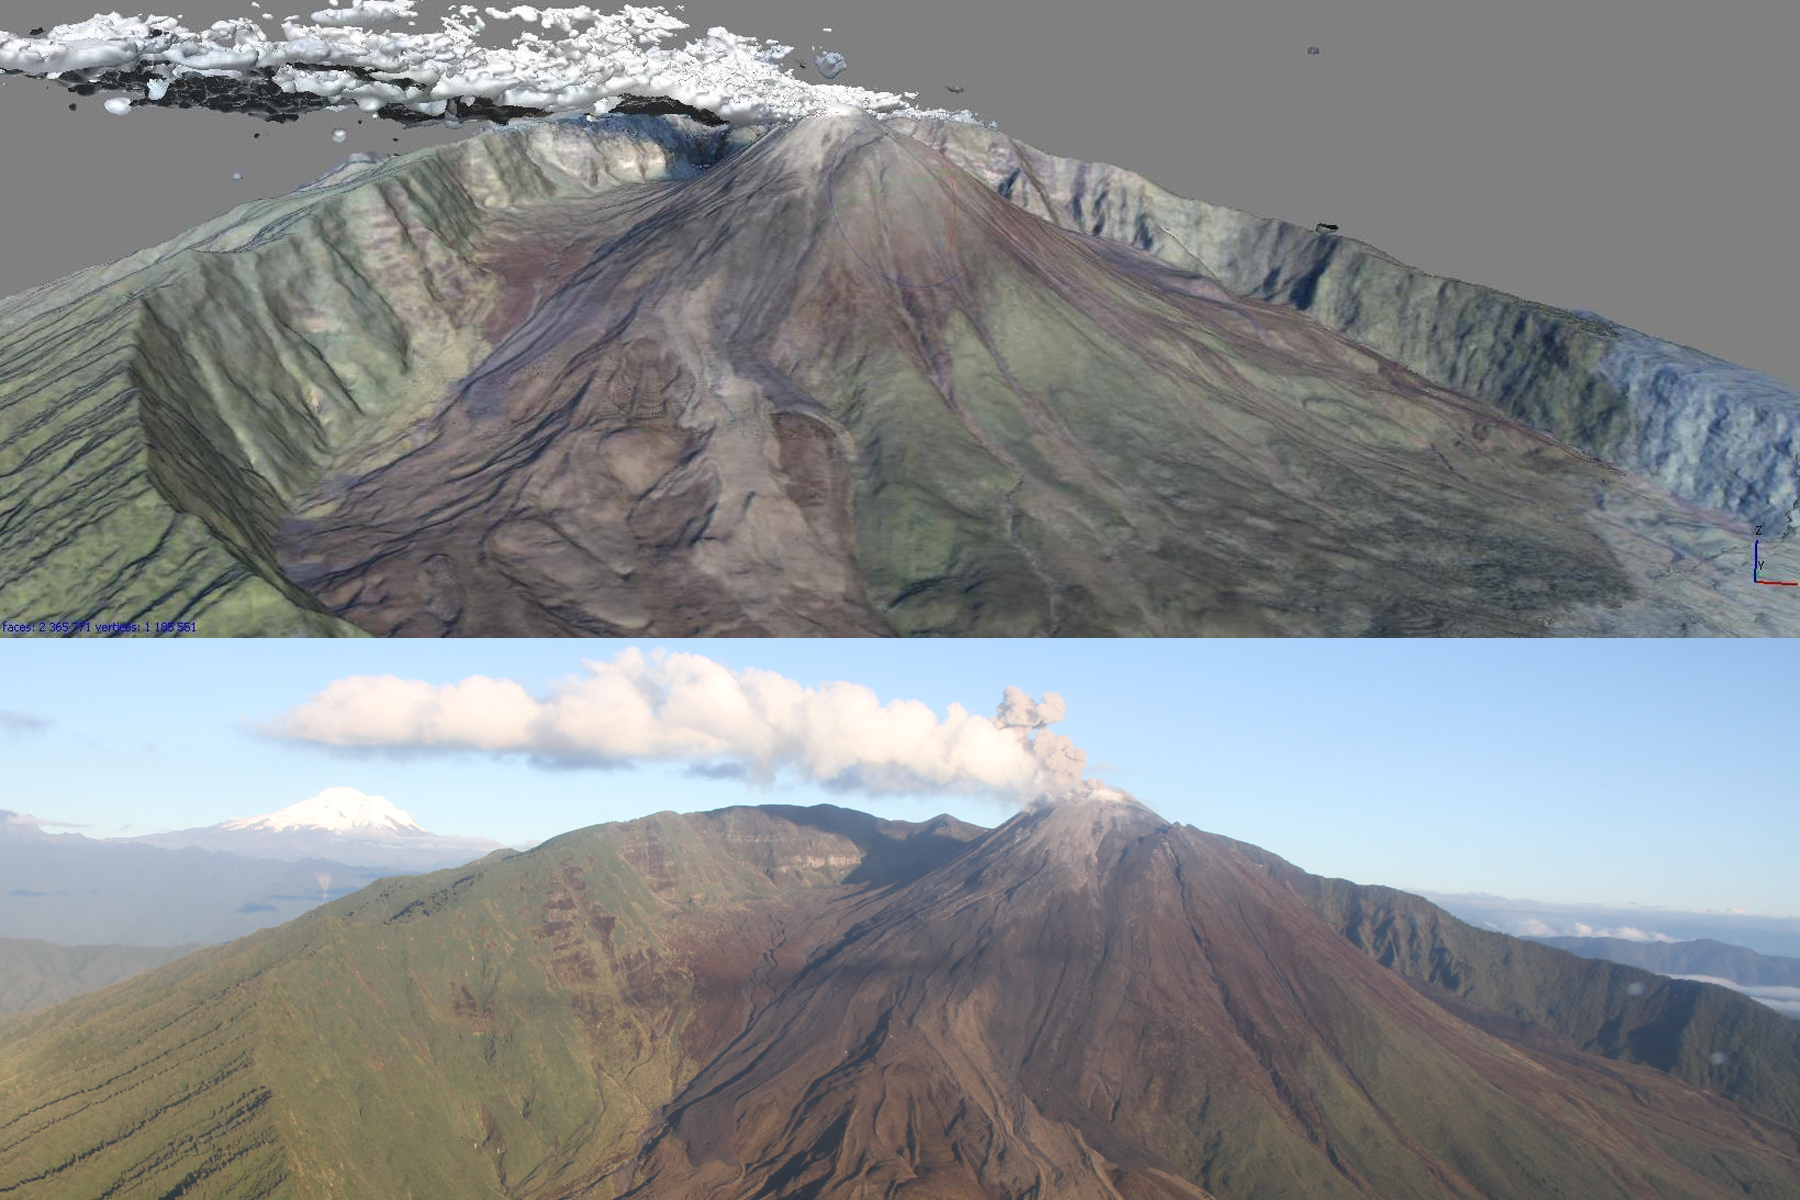
Photo by Angie Diefenbach | Execerpted from the USGS: eros.usgs.gov/doi-remote-sensing-activities/2013/usgs/oblique-photogrammetry-monitor-volcanoes
In 2013, the US Geological Survey trained and worked with colleagues at the Instituto Geofísico-Escuela Politecnica Nacional (IG-EPN) in Ecuador to collect and process imagery using photogrammetry techniques to monitor eruptive activity at Reventador volcano. The above photo shows the oblique views of Reventador volcano represented as a digital elevation model with RGB values added. The below photo is one of several hundred images used in photogrammetric processing. Note the vapor and ash plume that masks part of the summit lava dome. Plumes and other atmospheric effects are common problems when imaging active volcanoes and are typically edited out during post-processing analysis.
The result: a high-resolution 3D reconstruction that contains not only elevation/height information, but also texture, shape, and color for every point on the map, enabling easier interpretation of the resulting 3D point cloud.
However, photogrammetry can also apply to interior structures. To remember, photogrammetry works in any environments that have a sufficient quantity of visual features. A visual feature is any point that is distinctive enough to be recognized by a photogrammetry algorithm. Note that visual features depend on the scale. Some surfaces appear homogeneous from a given distance, but many features become visible as you come closer.
Favorable environments for photogrammetry include natural rocks, brick walls, old painted structures, cracks and corrosion. Unfavorable environments for photogrammetry include concrete walls with high uniformity, homogenous and/or shiny painting, shiny metallic surfaces, stainless steel and glass windows. A good rule of thumb for photogrammetry is the more visual features the better.
Over the past 10 years, LiDAR has become the technology of choice for deriving highly accurate terrain data and 3D models, and it is commonly used for a variety of mapping applications in markets as diverse as forestry and transportation. At the same time, the rapid adoption of digital aerial cameras and the movement toward digital workflows has changed aerial mapping forever. The significant improvements that have been made in the radiometry, accuracy and resolution of digital aerial data, and the increased volume of data that can be collected due to the larger swath width and onboard storage has led to the development of many new applications.
Another factor that has improved the use of photogrammetry is the processing software that allows more automation to produce a variety of end products more quickly than in the past. The hardware and software used to collect and process digital aerial images has evolved to the point where very dense point clouds and accurate digital surface models (DSM) and digital terrain models (DTM) can be automatically generated from multiple overlapping aerial images using multiray photogrammetry. Conceptually, multiray photogrammetry is not new; academia has been experimenting with the technology for years. The difference is that today there are cameras capable of collecting data with sufficient forward and side overlap and density to generate point clouds using highly automated workflows.
LiDAR uses lasers to accomplish many of the same tasks as photogrammetry, and the technology behind LiDAR is similar to how radar uses radio waves. In LiDAR applications, rapid pulses of laser light are fired at a surface, in some cases at a rate of 150,000 pulses per second. A LiDAR sensor measures the amount of time it takes for each pulse to bounce back from the earth’s surface to the LiDAR instrument.
This process is repeated in rapid succession until the LiDAR captures a map of the land area it is measuring that meets the degree of detail that the surveyor requires. A point cloud is then generated.
How Photogrammetry Works
Photogrammetry is a combination of photography and software. The first stage of photogrammetry is taking photographs of the subject area and the objects inside. This step entails taking a series of photographs at different angles and ensuring that there is enough area overlap between photographs so that no portions of the area delineated for study are missed. Angles and alignments must be carefully considered to ensure that you have a complete pictorial representation of the area you are photographing.
Photographs taken should also be sharp and of high resolution. Why? Because every pixel point in each photograph defines a light ray in 3D space that starts at the camera and extends out to a central reference point in the subject area that is used for measurement. Each photograph taken is imported into a photogrammetry processing software that requires not only each area photograph but also the position and angle of the camera for that photograph, along with the camera’s focal length, pixel size, and lens distortion.
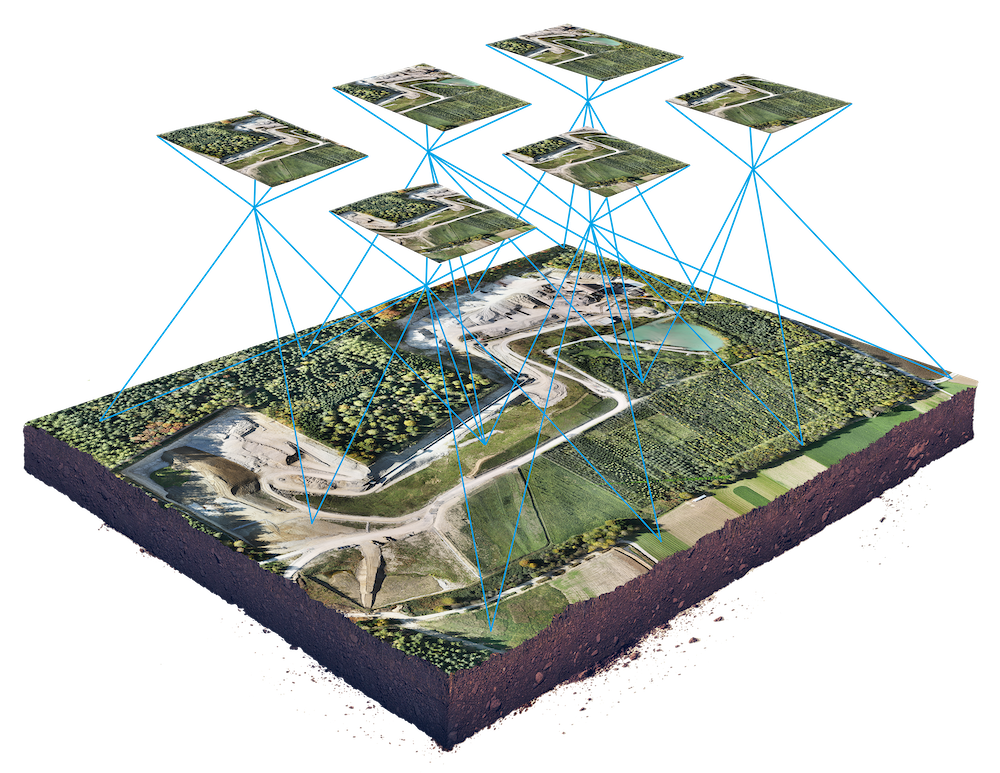
Excerpted from: wingtra.com/drone-photogrammetry-vs-lidar
Photogrammetry combines images that contain the same point on the ground from multiple vantage points to yield detailed 2D and 3D maps.
With this information and a point identified on two or more photos, the photogrammetry software finds the geometric intersections of the light rays and figures out where those points are located in 3D space. The goal is finding where the photographs overlap.
This method of using multiple photos for solving points is called “triangulation.” Points are matched in a “ray intersection” when two different photographs overlap. The photogrammetry software additionally uses mathematical algorithms to decipher camera locations, angles, and characteristics, which it can achieve with just a few point matches. The end result is the creation of lines, surfaces, texture-maps, and full 3D models that are derived from 3D point locations in the photographs.
