Designing for the Impacts of Very Severe Hail


Learning Objectives:
- Define Very Severe Hail (VSH), and its financial and geographic implications.
- Understand the severity of hail damage to roofs and the implication on occupancy and operations.
- Recognize the basic configurations of approved assemblies.
- Compare and contrast the effects of different VSH options and review design strategies.
Credits:
First things first. If you don’t practice in or own a building in hail alley or a building insured by FM Global, why would you need to read this article?
- Roofs are the first line of defense against severe weather events, including hail.
- The geographic footprint of hailstorms has expanded and about two-thirds of the United States experiences 1 inch or larger hailstones, increasing insurance claims to $16.5 billion in 2020.
- While FM requirements only apply to FM insured buildings, the potential for damage applies to all buildings. It is not uncommon for owners and designers that do not insure buildings through FM to elect to follow FMs guidelines to protect their investments and mitigate their design risk.
And if you do practice in or own a building in hail alley, how will you know which Very Severe Hail (VSH) rated assembly to select out of the 16,500+ approved assemblies?
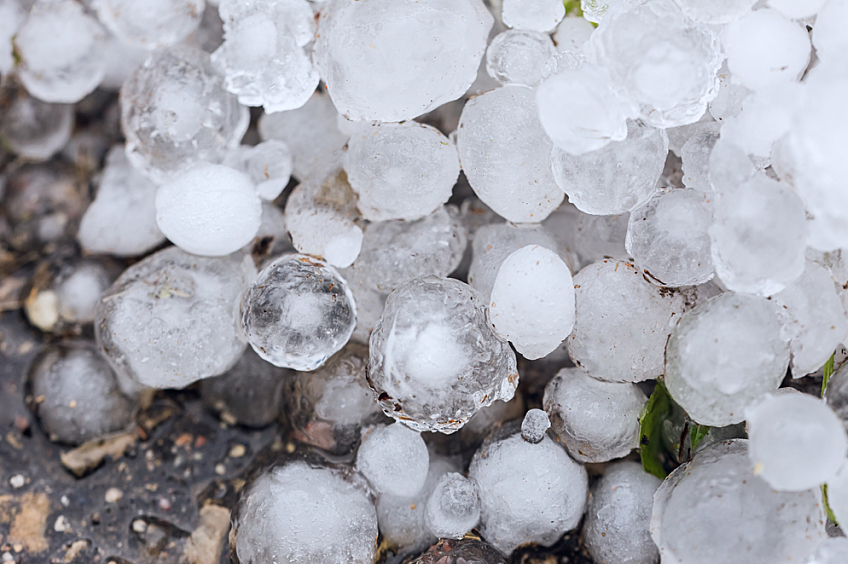
Photo courtesy of GAF
What in the Hail Does Very Severe Hail Mean?
When VSH requirements were introduced to the roofing industry, it was as if all hail was about to break loose! The issue was obvious. Buildings were being pelted with larger and more frequent hail storms. In 2018, insured losses from hailstorms topped $10 billion in the United States for the 11th year in a row.1 According to the National Center for Atmospheric Research, hail events account for 70 percent of the average annual property losses from severe convective storms in the United States.
How in the hail was the industry to respond to VSH? Before unpacking the impact of hail, and how the roofing industry has and is responding to the need to enhance the protection of buildings from the damaging effects of hail, let’s start with understanding it.
Hail is solid ice that forms when raindrops are carried upward by thunderstorm updrafts into the extremely cold atmosphere and freeze. Hailstones collide with liquid water that freezes onto the surface of the hailstone. Hail falls when the thunderstorm's updraft can no longer support the weight of the hailstone and
According to National Oceanic and Atmospheric Administration’s National Severe Storms Laboratory (NOAA NSSL), VSH (2 inches in diameter or larger) forms in supercell thunderstorms as they have sustained updrafts that support large hail formation by repeatedly lifting the hailstones into the very cold air at the top of the thunderstorm cloud where they can accumulate more layers of ice.
NOAA produced a report on “The Frequency of Large Hail Over the Contiguous United States” back in 2003.2 This report notes that the annual average number of reported severe hail events jumped from about 1,100 in the late 1970s to almost 2,500 in the early 1980s. The area roughly correlated to “tornado alley” reported more than 600 severe hail reports per decade.
During the winter, severe hailstorms are generally restricted to the Southeast. Most activity occurs in a band from east Texas to north Alabama. Meteorologically, this is a reflection of the relatively cool temperatures across the continent, the general lack of moisture in the air anywhere but along the coast of the Gulf of Mexico, and the low sun angle that limits the area of insolation sufficient for thunderstorm development. In April, the sun angle and length of daytime heating increases and moisture returns northward due to the strengthening of the Bermuda High. This, in concert with northward migration of the jet stream, shifts the maximum hail area to Oklahoma and the Red River Valley.
Continued northward progression shifts the July maximum to the Plains from eastern Colorado to northern Minnesota. There is also a weak summer maximum in smaller hail sizes over the desert southwest, indicating reports from hailstorms occurring with the North American monsoon. The northwestern states also have a small signal during this period, as extreme heating along the sloping terrain during the summer months helps to produce instability over this region leading to some severe hail producing storms. A small July area of enhanced hail activity is also located in Central Florida in the area where the Atlantic and Gulf of Mexico sea breezes often interact. Over the rest of the Southeast, except for along the Appalachians, hail activity during the summer is suppressed by the warm troposphere. In the autumn, the severe hail activity pattern is quite similar to the spring pattern. However, the occurrence rate is greatly diminished.
NOAA reports a significant increase in hail events over the past decade, averaging over 5,300 events annually. Hail-related insured losses between 2000 and 2019 averaged between $8 billion to $14 billion a year, according to Aon.3 There were 4,611 major hail events in 2020; 3,763 major hail events in 2021; and already 3,203 in 2022 as of June 30 2022, according to the NOAA’s Severe Storms database. Despite this large number of events, collectively they have fallen below the 10-year average.
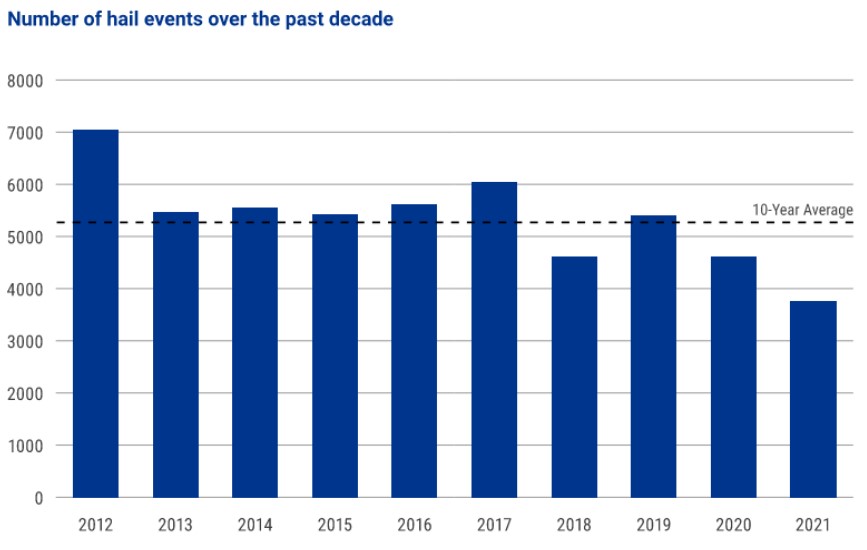
Source: NOAA, graphed by Verisk
Figure 1: Number of hail events over the past decade. The past 2 years, the number of hail events have slipped below the 10 year average.
The Insurance Information Institute reports that Texas, South Dakota, Kansas, Oklahoma, and Nebraska have had the greatest number of hail events in the past two and a half years. These five states alone have experienced nearly 2,000 hail events in just a 2-year timeframe.
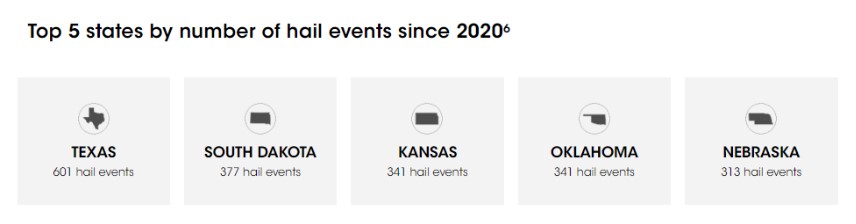
Source: Insurance Information Institute, Facts + Statistics: Hail
Figure 2: The top 5 states by the number of hail events since 2020.
